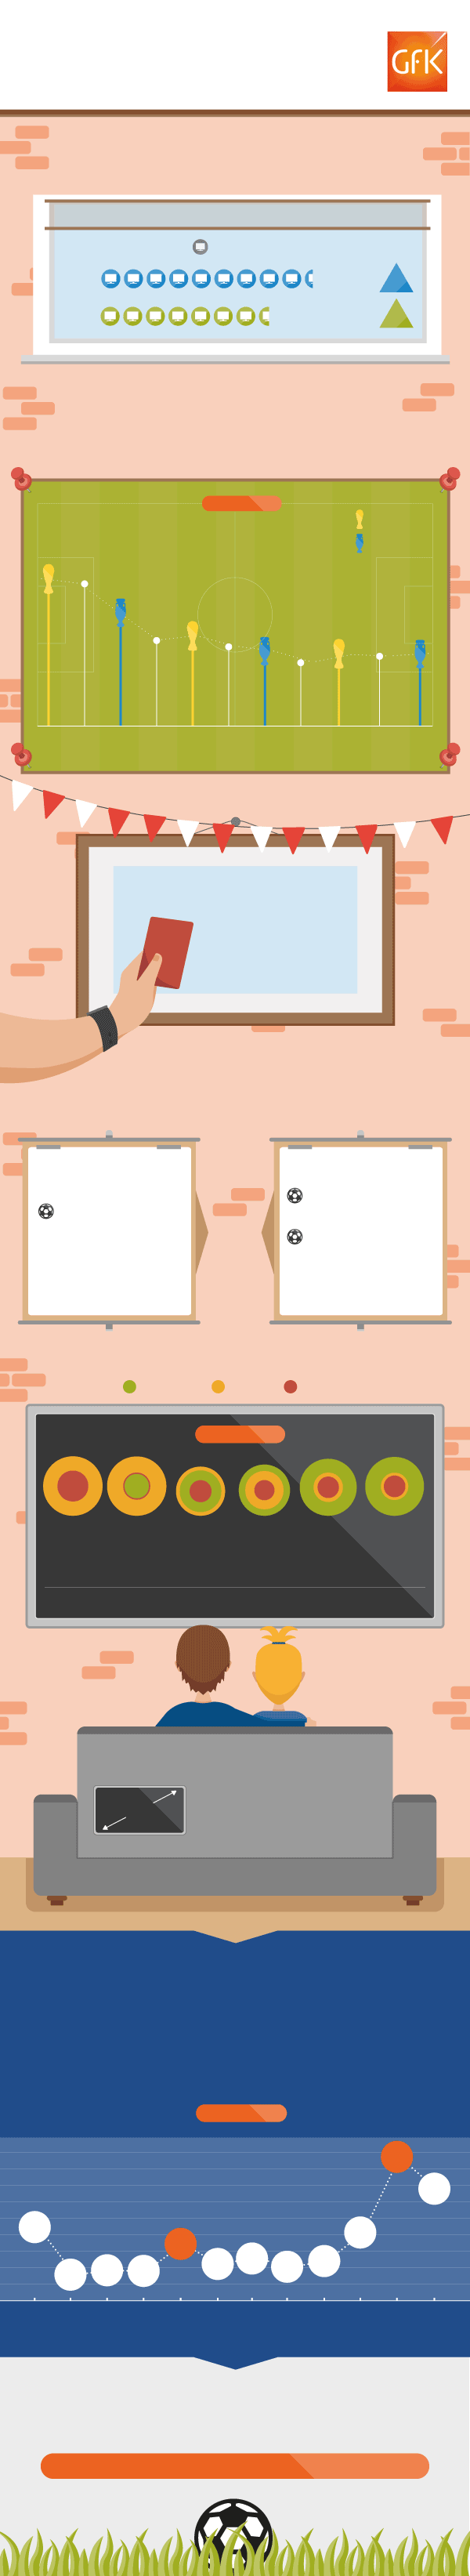
The world cup TV sales – What’s the real impact?
They shoot, they score!
Big “football years” hit the back of the net for TV sales, with May and June being the large scorers.
Units sold (y/y)
453,000
May 18
23%
361,000
Jun 18
25%
Source: GfK Forecast
We forecast 5.48 million TVs will
be bought this year
From 2012, “Football years” consistently see May and June upping their share of full-year sales by around +2%
More info +
GB PTV Annual Unit Share in May/Jun (%)
World Cup year
Euro Cup year
9.57m
9.31m
7.74m
6.50m
6.26m
5.67m
5.48m
5.54m
5.94m
5.41m
5.07m
2010
2011
2012
2013
2014
2015
2016
2017
2018*
2019*
2020*
* Forecast
What if England are knocked out early?
We calculate 2018 sales would take a dive of around 66K units, compared to our standard forecast…
Manufacturers & retailers -
fighting back with focused tactics
Consumers’ goals
Manufacturer & Retailer tactics
Price, then dimensions, then features.
Design and brand become significantly more important when buying higher priced TVs
Promotions to push higher average selling price (ASP) units, driven by the latest features
ULTRA HD OR 4K SETS DOMINATE THE FIELD
Full HD
HD ready
Ultra HD/4k
(Mio. Sales Value in £)
More info +
296
872
1321
1637
1745
1782
1773
1217
737
431
372
480
369
242
202
229
233
2013
2014
2015
2016
2017
2018*
* May 2017 - April 2018
WHAT ARE THE GOAL WINNERS?
The bigger the better!
GfK expects average screen size to rise to 43.1” in May to June. This is +0.6 inches greater than the average size forecast for sales from other months
43.1”
May/June 2018
“World Cup fever” hardly scores, compared to Black Friday and Christmas run-up
GfK forecasts that the Black Friday spike in PTV sales will be almost twice as big than the World Cup spike.
GB PTV 2018 demand
Million units sold
More info +
0.84
0.7
0.53
0.5
0.45
0.39
0.38
0.36
0.35
0.33
0.33
0.32
Jan
Feb
Mar
Apr
May
Jun
Jul
Aug
Sep
Oct
Nov
Dec
The season ahead
Want to know which brand had the best-scoring ad during the World Cup? Or the detail on how consumers go about deciding which TV to buy?
Then partner with us to win the match! +

Data +
+8.1% y/y unit
growth this year sounds good!
But don’t celebrate yet.
The long-game trend shows a steady decline in TV purchases over the current decade, in which ‘World Cup fever’ years deliver only temporary respite.
In 2010, 9.6 million TVs were sold, falling to 6.5 million in 2014, and GfK forecast just 5.5 million sold by the end of this year.
* Units sold ** Forecast
9.6m*
2010
5.5m
2018**

Data +
To offset the long-term fall in unit sales, manufacturers & retailers are pushing higher ASP TVs, justified by the latest features.
In the last world cup, retailers mainly promoted HD-ready. This year, we expect them to push 4K, tapping into the excitement of bringing ultra-realistic images into the heart of your home. [GfK Consumer Life: 61% of UK consumers say “My home is a private retreat where I can relax and get away from it all” – up from 55% in 2014].

Data +
Despite the promotional frenzy that the World Cup generates, our data shows the real action is seen around Black Friday.
We forecast nearly twice as many units to be sold in November compared to May (848,000 vs 453,000).
That’s not to say Retailers should ignore the consumer opportunities that World Cup fever brings. Because it not just about the sales. This season of intense consumer interest and partisan feeling is exactly the time to forge bonds with your target audience via a shared common passion.
So put out those Premiership-worthy promotions, to make sure your brand is in podium position for the really big buying season in November.